
OfTheCross
Veteran
The white working class’ share of the overall population has also fallen steadily and is now at an all-time low. In 1975, over 7 in 10 U.S. individuals were white working class.2 Each year thereafter, their share decreased, dipping below a majority (49.8%) in 2004 and hovering just below 40% in 2018. (See the figure below.)
In contrast, non-Hispanic whites with at least a four-year college degree and the group of Hispanics, blacks and other nonwhite races with less than a four-year degree steadily increased their overall shares for more than 40 years and have very similar population sizes today: 55.3 million and 55.8 million in 2018, respectively.
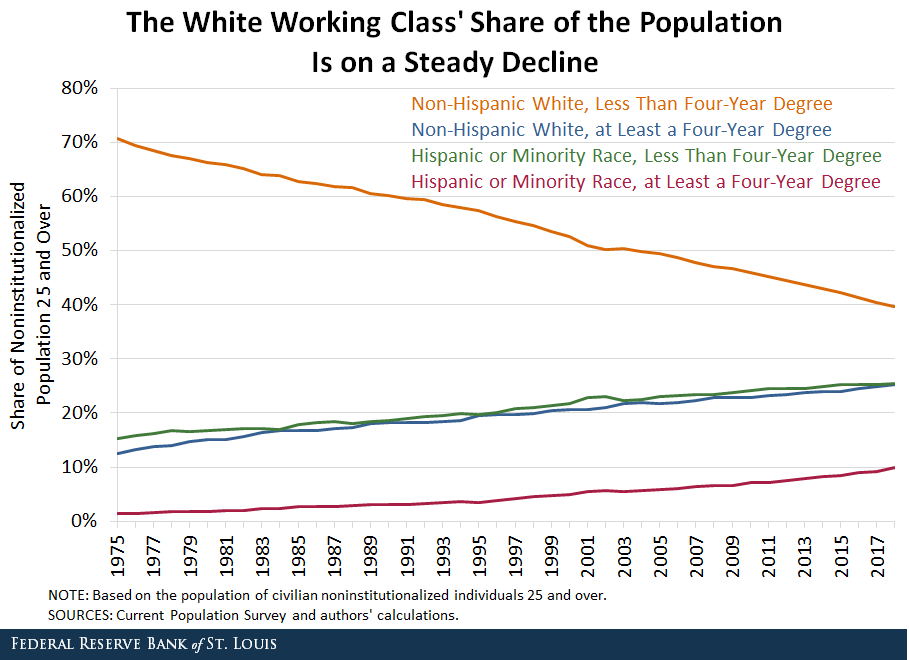
Many more whites are college grads today, and a combination of immigration and higher nonwhite birthrates has driven up the number of minorities (with and without college degrees). While difficult to disentangle the relative importance of these effects, the population shares of white four-year college graduates and nonwhites more than doubled between 1975 and 2018 (to 25% and 35%, respectively), indicating both are key factors in the white working class’ declining share.
link
the White's are all white collar guys nowadays