
U.S. Building More Apartments Than It Has In Decades, But Not For the Poor: Report
Apartment construction has reached a 50-year high, but the amount of units affordable to the lowest income groups has decreased nationwide.
 www.vice.com
They're not regular estate agents, they're cool estate agents.
LP
By Laura Pitcher
April 24, 2023, 3:45am
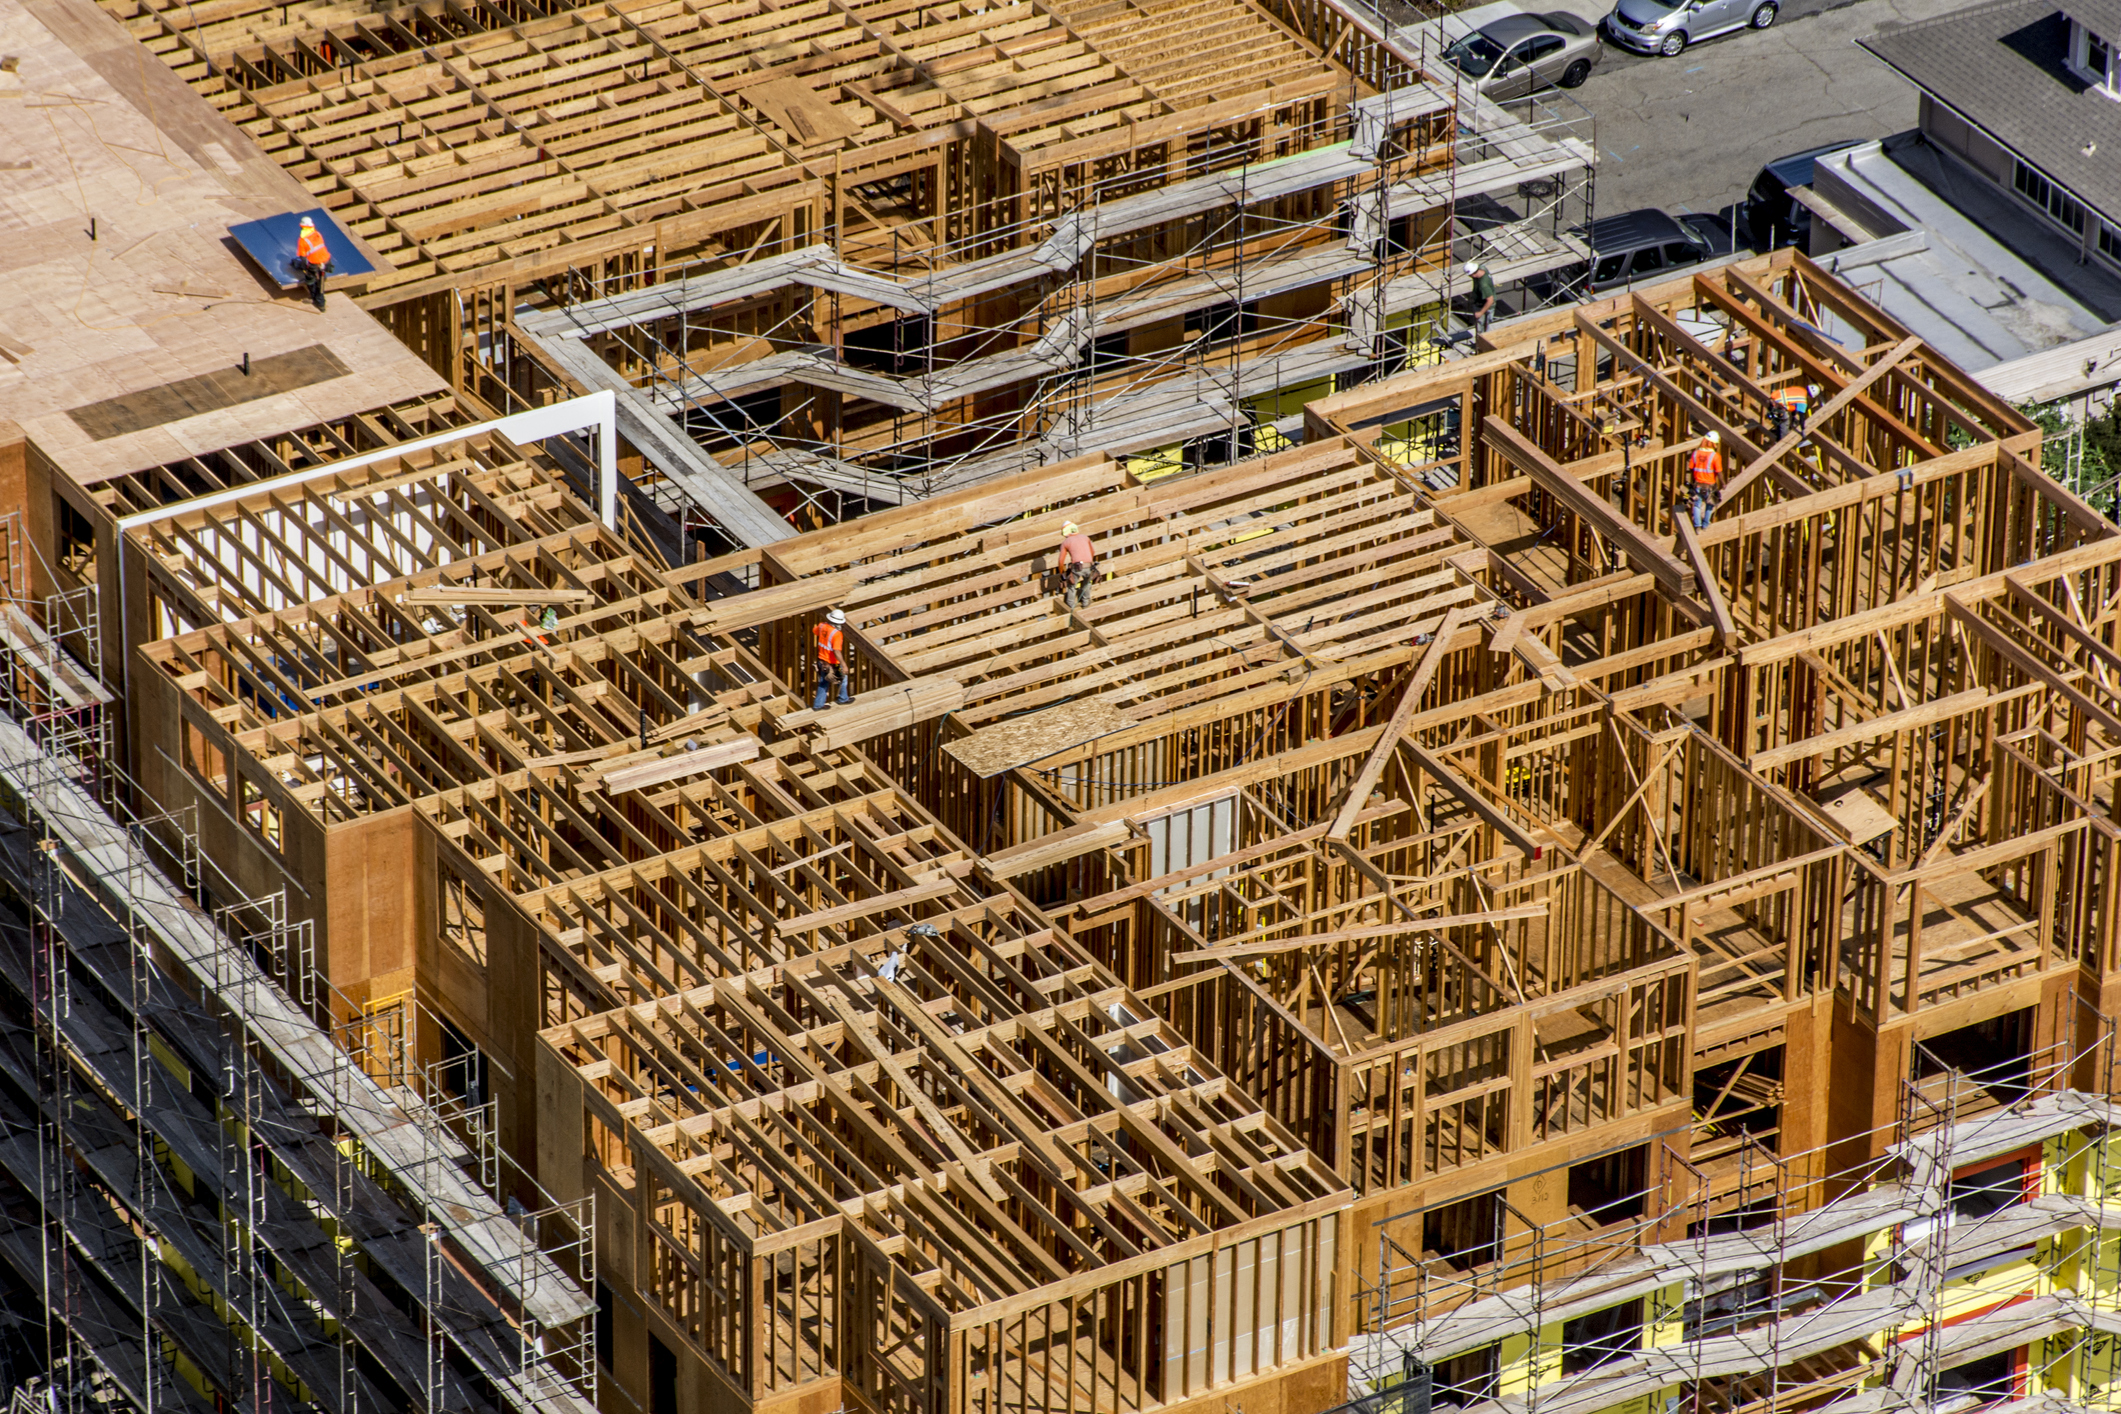
IMAGE: STEVE PROEHL VIA GETTY IMAGES
The U.S. is building more apartments than it has in half a century, but the poorest people still can’t afford them.
The amount of units affordable to the lowest income groups has decreased across the country even as apartment construction has reached a 50-year-high and even as overall rent growth is slowing, according to a report from Harvard’s Joint Center for Housing Studies.
There are many reasons for this, the report’s authors explain, but the main one is that new units being produced are on the higher end and not affordable to people with the lowest incomes. Coupled with rent increases and deteriorating buildings, it means the benefits of the housing boom have been uneven. According to the report, “while multifamily rental construction is at a decades-long peak, the high asking rents of new units make them unaffordable for many households.”
According to Sophia Wedeen, a research analyst at the Joint Center for Housing Studies, some of the problems laid out in the report can be remedied with subsidies like housing vouchers. “Housing assistance is really effective and wonderful for the households who get it, and obviously, there's not nearly enough funding,” Wedeen said in an interview with Motherboard.
Wedeen said the loss of low-income units was a geographically widespread problem. “It's a little bit startling that the supply of low rent units is falling everywhere. Even in places like Ohio and Michigan, Missouri, Indiana, low cost states that have previously had the largest shares of low rent units. These states are losing low rent units too.”
In theory, the increased supply of apartment units should slow rent growth. And the report shows that, broadly, this is happening. But the housing market, as reflected in the report, is more complicated than that. There are many housing markets depending on your income, geography, or—due to both a wealth gap and widespread illegal discrimination—race. And while these markets interact with each other, they can require different remedies to preserve affordability. But the data suggest that building high-end housing is not easing pressures on the lowest end of the housing market, as some advocates focused predominantly on supply-side housing solutions have hoped.
According to the report, “rental markets are experiencing sharply reduced rent growth and rising vacancy rates,” but this is only compared to the sharp jump in rents that took place during the pandemic, in large part because of migration by remote workers between cities, which created bottlenecks for housing applications and around the block open houses in Brooklyn.
While rent growth is slowing down—even on the lower end of the spectrum—the cheapest units are still disappearing faster than they can be replaced, and building high-end housing isn’t remedying that. Wage growth has also not caught up to rent growth, so the overall slower growth in rents may not mean much to people on the lowest end of the income spectrum.
The report says that, adjusting for inflation, the number of units with rents below $600 fell from 11.9 million to 8.0 million between 2011 and 2021. There was also a loss of 1.5 million units with rents between $600 and $799, as well as a loss of 980,000 units renting between $800 and $1,000 in the same time period.
But new housing is mostly on the higher end: relying onCensus data, the researchers found the asking rent for new multifamily rental housing units in 2022 was $1,800, affordable only to people earning at least $72,000. (This is based on the standard used by the federal government that housing costs should be 30 percent or less of someone’s income to be deemed affordable.)
Even manufactured homes—once colloquially referred to as mobile homes—have seen decreases, with just 113,000 “shipments” in 2022, whereas an average 302,000 were once produced annually in the United States in the 1990’s.
This is all happening as the United States is experiencing a construction boom: according to the report, 547,000 new units of multifamily rental housing began construction last year, the most since the 1980s. In March 2023, 960,000 were under construction, the highest in 50 years.
The share of cost-burdened households (meaning more than 30 percent of their income is spent on housing) increased across the country by 1.2 million between 2019 and 2021, to a record 21.6 million. And 11.6 million households are severely cost-burdened, meaning more than 50 percent of their income is spent on housing. There’s still a housing shortage of roughly 6.5 million homes, the result of a slowdown in housing production after the 2008 mortgage crisis and the deterioration of homes in the last decade.
Housing on the lowest end of the spectrum is being lost to rent increases, as well as “building condemnations and demolitions,” meaning much of the housing stock is simply deteriorating. This trend will not reverse without significant institutional or government investment: The report said that the median home in 2021 is 43 years old, the oldest it has ever been. And the Federal Reserve Bank of Philadelphia estimates the nation’s homes need $149 billion in repairs. The problem will be exacerbated by housing destroyed in climate disasters, and financial data company CoreLogic estimated that 14.5 million homes had $57 billion in damages in 2021, according to the report.
Housing economists refer to a process called “filtering” to explain how new market rate housing construction can alleviate rents across the income spectrum. As the theory goes, once people move into high-end units, they free up homes for people on the lower end of the spectrum, and so on until the lowest income renters have more vacancies and lower rents. But there are huge caveats to this process, which is not nearly as tidy as is often presented.
Overproduction on the high end can lead to disproportionately high vacancies at the top of the market, as institutional landlords can prefer prolonged vacancy to lowering rents when no one wants to pay their asking price. New York City, for instance, has longhad aglut of empty luxury apartments.
And the effects of filtering offer diminishing returns for people on the lower end of the market, with vacancies higher at the top and consistently lower on the bottom. Building new market-rate units also doesn’t resolve the problem that lower-end housing is often in poor shape and in need of rehabilitation. One 2022 reportout of UC Berkeley’s Urban Displacement Project even found that new market rate units led to rent increases for people on the lowest end of the spectrum as well as people in deteriorating housing stock, even as it moderated rents for mid-income and high-income renters. Filtering also does not address how patterns of residential segregation can constrain the supply for some renters but not others.
The mismatch is most pronounced in Texas, which had “the largest decline of any state, losing 512,000 units with rents below $600,” over half the housing stock at the income level. At the same time, the state gained 742,000 units renting for $1,400 or more.
According to the Harvard report, “Given that the bulk of new construction targets the higher-cost market segment, the robust pipeline of multifamily units may lead to additional vacancy rate increases that will simultaneously help to limit rent growth for high-cost units, while likely providing less relief to renters with lower incomes.”
There are other culprits. Incomes have not risen nearly as fast as rents. According to the report, between 2019 and 2021, median monthly rents increased 3 percent as the median income of renters dropped 2 percent. It was even worse for renters who make less than $30,000 a year; their rents rose 5 percent in the same time period while their incomes fell 6 percent.
Compare this to the profits of landlords, calculated as net operating income (NOI), or what property owners have left over after paying taxes, maintenance and other costs. NOI grew 8.1 percent in the first quarter of 2023, and this was actually a stark decrease in growth from the 24.8 percent NOI growth in the second quarter of 2021, according to the report’s analysis of the NCREIF property index.
And people at the lowest end of the income spectrum often end up paying different types of “poverty taxes,” as landlords overcharge tenants, deeming them high-risk, as research has shown.
While apartment construction was at a peak, new single family home construction slowed down in 2022, largely due to the federal reserve’s decision to raise interest rates and make it more difficult for developers to borrow money.
The economic situation has been working out for corporate investors, though, and their overall share of the housing market has grown. According to the report, “the share of rental properties owned by non-individual investors increased by 9 percentage points over the past two decades to 27 percent in 2021.” About two-thirds of properties with 5 to 24 units are now owned by corporate investors. Research from the National Low-Income Housing Coalition found increased investor purchases led to more evictions.