Yes it has. Since i trade 9 tickers, i send screen shots of the 5m, 1hr and daily time frame charts along with screen shots of the dex,gex,OI, and volume data usually for contracts that expire same day or 7 days out. I usually get in and out the same day though.
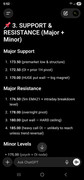
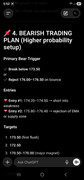
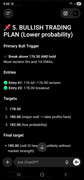
It quickly identifies major support and resistance, minor cluster zones, whether if gamma/delta exposure is positive or negative based off of current price, price where most interest is invested in, and gives me entry and exit points.
It also breaks down whether the chart and data of a stock is bullish or bearish or nuetral(consolidation/choppy). Gives me confidence level for each trade.
Honestly been a game changer with me since i started trading more than just SPY/QQQ/IWM. heres a screen shot example:
I use the Data Analyst AI. If u want the prompt, let me know.


 Yea
Yea Im a genius at work bc of it lol


